 العربية
⬜ The Main Dashboard in Aurest
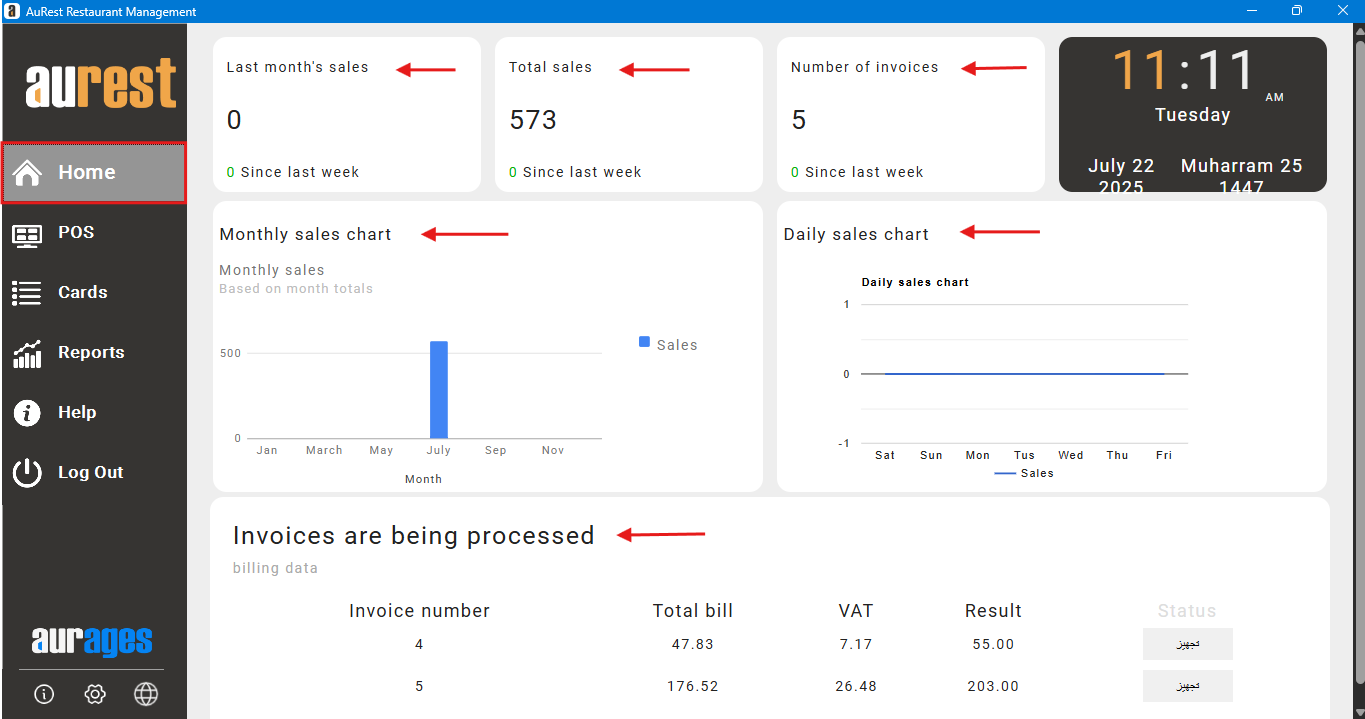
The main dashboard in Aurest is a smart visual panel that appears immediately upon login. It allows users to monitor key daily and monthly performance indicators in real time, supporting instant decision-making and better operational analysis.
✅ 1. Top Performance Indicators
At the top of the screen, three key indicators summarize the current sales and invoice activity:
1️⃣ Invoice Count
➤ Displays the total number of invoices issued on the current day.
➤ Includes a direct comparison with the invoice count for the same day of the previous week.
2️⃣ Total Sales
➤ Shows the total value of today’s sales, including all order types.
➤ A percentage indicator reflects the difference compared to the same day last week (increase or decrease).
3️⃣ Last Month’s Sales
➤ Indicates the total sales value recorded during the previous month, along with the number of invoices issued.
➤ This serves as a reference point for comparing with current performance.
✅ 2. Sales Graphs and Charts
The dashboard features two interactive charts that help visualize sales trends:
1️⃣ Daily Sales Chart
◾ Displays sales activity across the current week.
◾ X-axis: Days of the week (Saturday to Friday).
◾ Y-axis: Sales values.
✳ Useful for analyzing day-by-day performance and identifying peak or slow days.
2️⃣ Monthly Sales Chart
◾ Illustrates sales progression throughout the current year.
◾ X-axis: Months (January to December).
◾ Y-axis: Total sales value per month.
✳ Helps evaluate seasonal growth and compare month-to-month performance.
➕ Benefits of the Two Charts Combined
◾ Provide a clear visual view of daily and monthly sales fluctuations.
◾ Support tracking trends and improving operational and marketing strategies.
✅ 3. Orders in Progress (Pending Invoices)
At the bottom of the screen, a table displays invoices that are still open and not yet completed. It includes:
◾ Invoice Number
◾ Total Invoice Amount
◾ VAT Amount
◾ Net Amount
◾ Current Status (In Preparation – Pending Payment)
✳ This section helps track active orders in real time without navigating to separate screens.
✨ Purpose of the Main Dashboard in Aurest
◾ Monitor performance indicators from a single place.
◾ Enable fast, data-driven operational decisions.
◾ Analyze daily and monthly sales trends effortlessly.
◾ Track active orders and maintain full control over daily workflows.